June is usually a mild time of year in the UK, the mix of sunny days and showers leading to the kinds of lush and verdant parks and garden that gained its “green and pleasant land” reputation.
But June 2026 was different. In all likelihood driven by an emergent climate change-supercharged El Nino cycle, June was a month of unrelenting heat for many parts of the UK, especially in England and Wales. Without widespread cooling infrastructure in place, a lot of systems simply weren’t able to cope. More than a 1000 schools closed, deliveries were slowed, trains couldn’t run. In an ironic twist, many London Climate Action Week events were cancelled because venues were too hot.
I was really interested in finding out who was affected and particularly where heat stress might be intersecting with other forms of social pressure.
Who’s hot? Almost everyone!
To get a handle on how many people were affected by heat exposure in June, I calculated how long people in England and Wales experienced days over 25C. The 25C cutoff is a bit arbitrary–in many parts of the country, it is the threshold for a heatwave, though the threshold is actually higher in London and SouthEast. Interestingly, academics have calculated that heat can have a negative impact on health in the UK at temperatures as low as 19C. So we can be pretty certain temperatures of 25C+ are going to have negative impacts on health. And it’s definitely a point at which you feel the heat, especially in a country where even hospitals do not consistently have air conditioning.
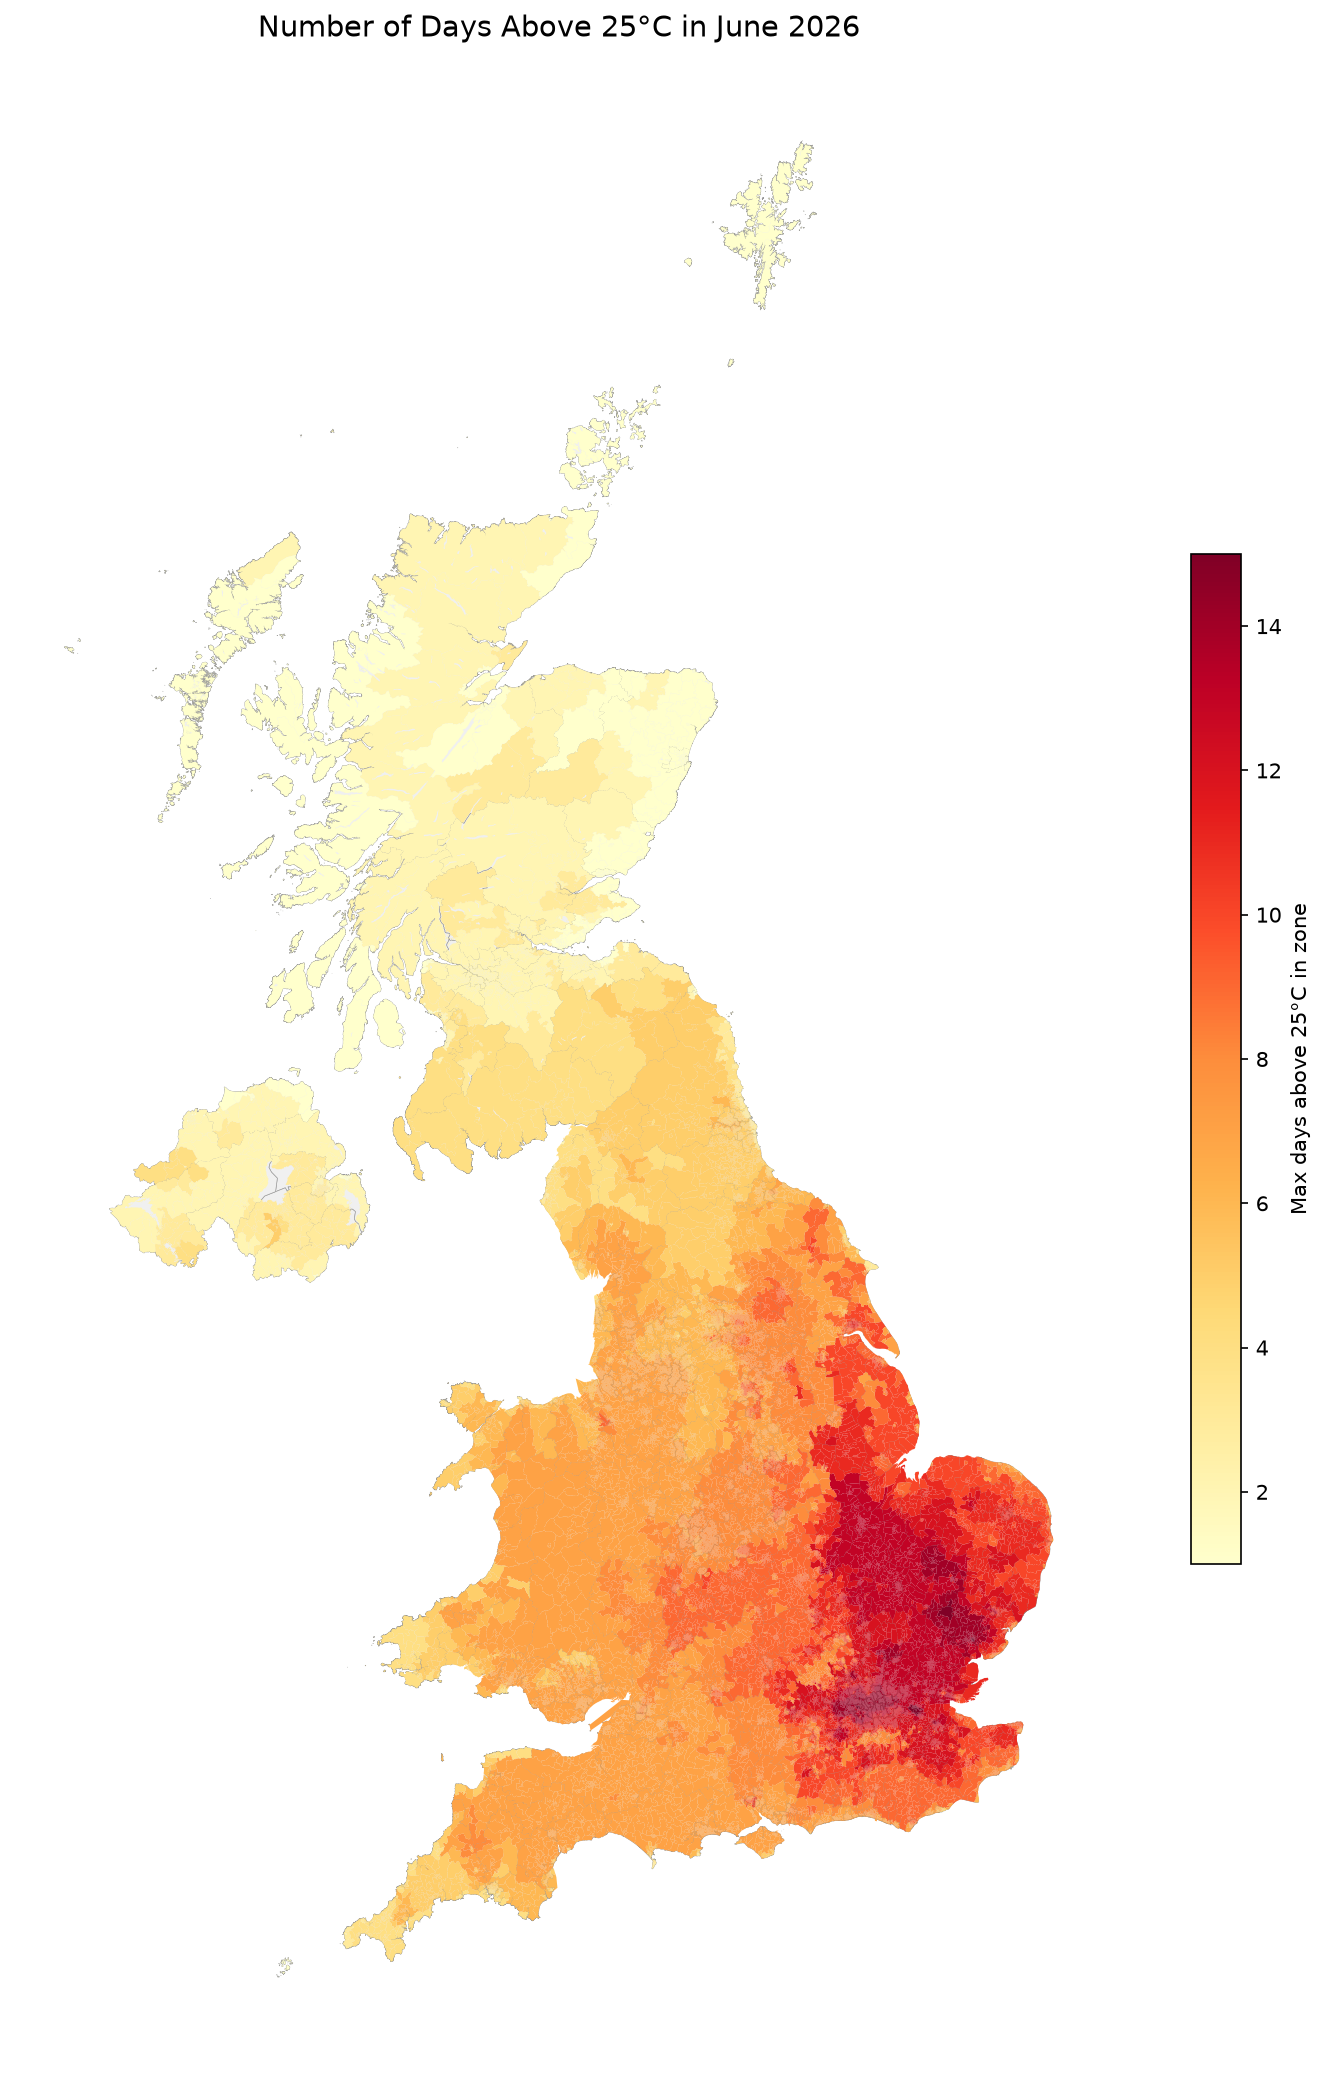
Prolonged heat exposure was definitely a widespread phenomenon during June. As the kind of committed northerner (despite my accent…) who goes around with a chip on my shoulder ready to be knocked off when people infer that London = England, it was really noticeable to me how widespread the heat impacts in June were. About 85% of residents in England and Wales experienced a week or more above 25C! Newcastle, where I live, used to feel like a bit of a safe haven. Not anymore!
I was curious about how this might affect more vulnerable populations as well. I couldn’t find current data on care home residents, but did find schools data, including estimated enrollments. Perhaps unsurprisingly, a similar proportion of students–about 86%–were enrolled in schools that experienced 7+ days of 25+ temperatures. I’ve kept the analysis here a bit basic, so we can’t say that those 25+ days were school days or weekends, but given the high numbers it seems safe to conclude that students were in schools on very hot days.
Vulnerability to heat
Of course we know that certain communities and populations are going to be more vulnerable to heat than others. Increased vulnerability can come from individual characteristics, like age or illness, or from contextual characteristics, like living in adequate housing or community crime levels. To what extent were particularly vulnerable people exposed to the UK’s high heat in June?
The UK’s National Heat Vulnerability Index was created by a group of consultants and academics in order to capture a number of factors that make people more vulnerable to climate change. It’s used to inform the UK’s Climate Change Risk Assessment. The index includes weighted measures for: age, health, income, access to information, physical mobility, housing type, tenure, and insurance, previous experience of climate events, crime, indoor airpollution, proximity to health services, access to greenspace, access to public services and social networks.
In order to understand where social vulnerability might intersect with recent high temperatures, I calculated the number of days over 25C experienced by people living in different levels of heat vulnerability.
While overall I found that the most heat vulnerable areas experienced fewer days of high temperature, in absolute numbers more than 4.5million people in the most heat vulnerable areas experienced temperature of more than 25C for 7+ days. That’s a lot of heat exposure for a heat vulnerable population.
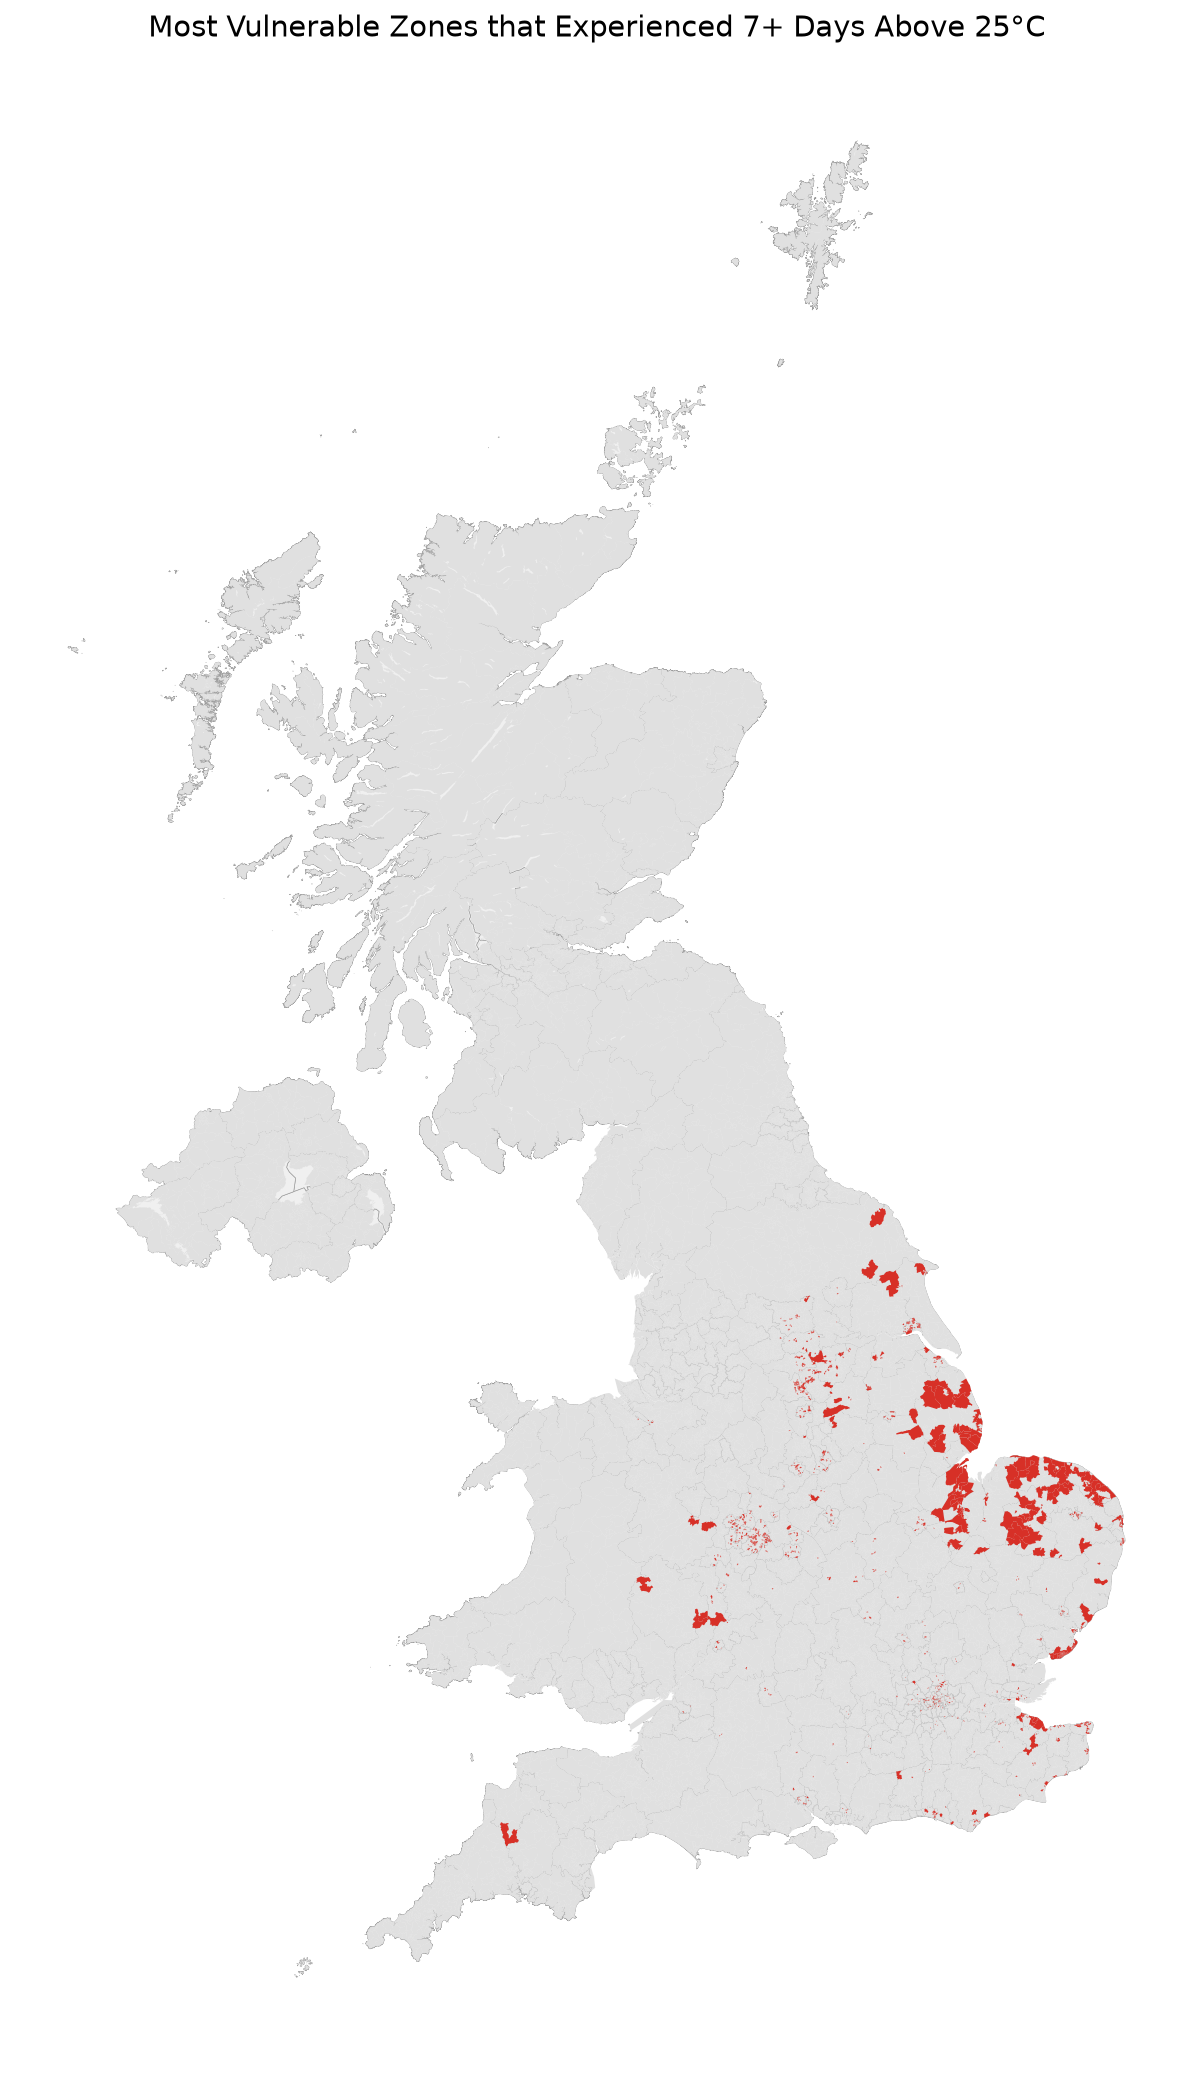
There are highly heat vulnerable and heat exposed areas throughout England and Wales (I didn’t include Scotland and Northern Ireland in this analysis for practical reasons, but in any case they experienced much less heat exposure than England and Wales). But there’s a particularly large cluster in Norfolk/Lincolnshire/Cambridgeshire, as well as clusters in London and Birmingham.
Exploring more…
Now that I’ve got the infrastructure set up to understand these relationships, I’d like to dive into them a bit more over the summer. Something tells me this isn’t our last heat wave…
Are there any questions this raises for you? Give me a shout and I’ll see if I can answer them in another iteration.
A bit of methodology
Temperature
To measure temperature, I decided to rely on the Met Office’s HadUK provisional estimates of air temperature for June 2026. These are estimated from around 200 weather stations across the UK, and modeled to a 1km grid. I aggregated this grid to the LSOA level to make comparisons to NHVI easier to make. To do this, I calculated the number of days over 25 for each of the points in the original dataset. For each LSOA, I chose the maximum of number of days over 25 from the point within that LSOA. Where an LSOA was too small to contain a point in the temperature grid, which was often the case in urban LSOAs I relied on the four closest temperature points.
Using the maximum number of days above 25C in an LSOA was the less conservative choice. I could have, for instance, used the mean. However, I found that in practice it didn’t make a huge difference in the results. In LSOA’s where there was some variation in temperature, the higher temperatures are largely attributable to more built up areas so it felt like maximum for each LSOA was the right way to go